See What Matters. Share What Counts.
Whether it’s client reviews, renewals, or internal reviews, Visual Insights helps teams across the business stay aligned on what’s happening and what to do next.
Continuous Operational Visibility
Monitor Microsoft 365 health, device lifecycle, license usage, data health status, and more from a single view.
Clearer Conversations
Create visual summaries to show what changed, what’s resolved, and where to go next, without chasing reports or technicians.
Growth-Ready Insights
Use asset trends, expiring licenses, and control gaps to support upsells, renewals, and roadmap decisions.
“Heavy easy access to this data is just priceless.”
– Bill Ledebuhr, Fantastic IT
Built For Every Role That Needs Clarity
Visual Insights empowers everyone from frontline techs to leadership.
-vCIOs & Account Managers: Show impact during QBRs and strategy meetings.
-Ops & NOC Teams: Watch for Inspector failures, license anomalies,
and coverage gaps.
-Security Leads: Surface compliance gaps and misconfigurations instantly.
-Executives: Get high-level account snapshots and monitor service performance.
Built-In Dashboards + Unlimited Customization
Six dashboards out of the box, with unlimited flexibility to create your own.
-Microsoft 265 License Dashboard: Monitor license assignments, usage, and potential sprawl.
-Liongard Health Dashboard: Track Inspector status, Agent deployment, and data collection health.
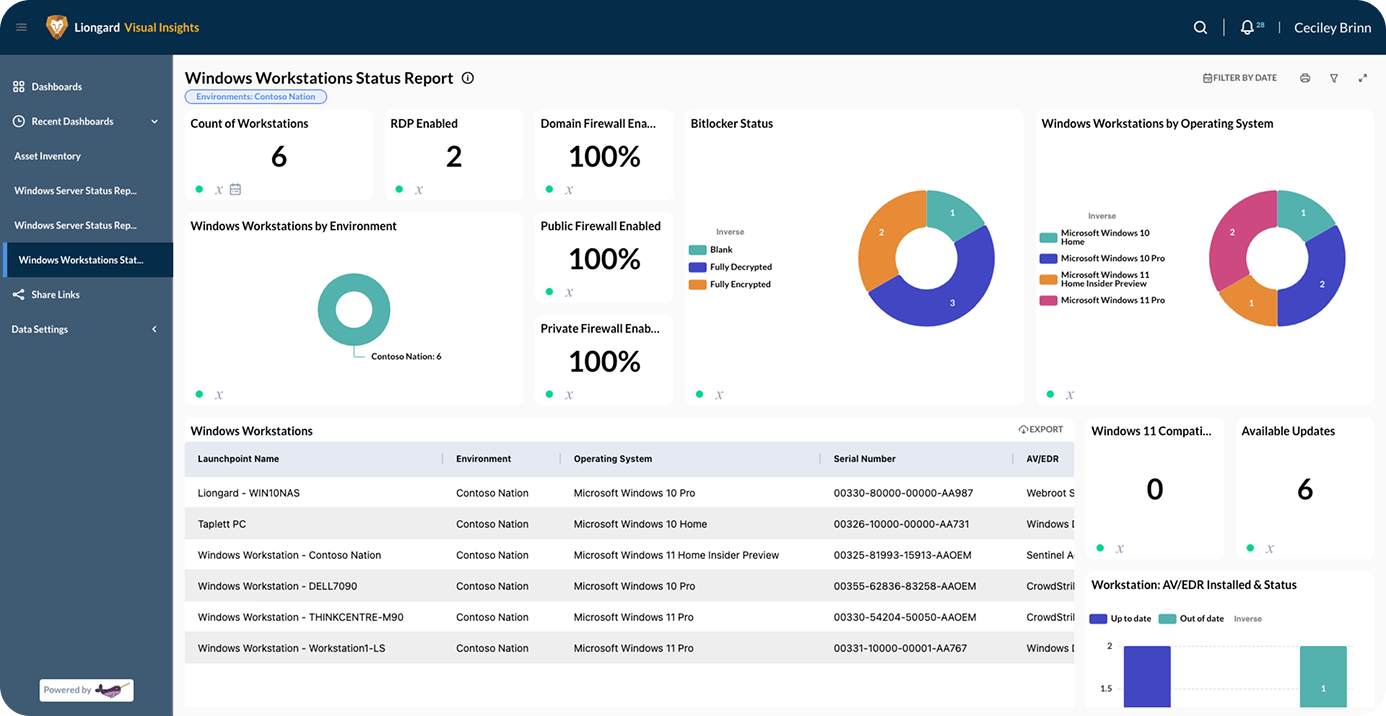
-Windows Workstation Status Dashboard: Identify unsupported OS versions, inactive endpoints, or outdated devices.
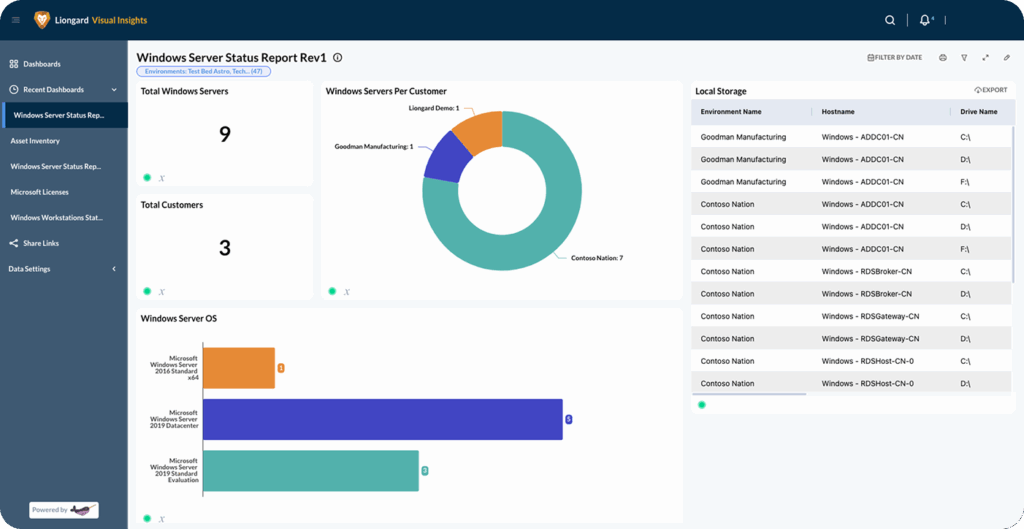
-Windows Server Status Dashboard: Surface configuration drift, patch status, and critical server insights.
-Expiration Dashboard: Track expiring domains, TLS/SSL certificates, and email authentication controls (SPF, DKIM, DMARC).
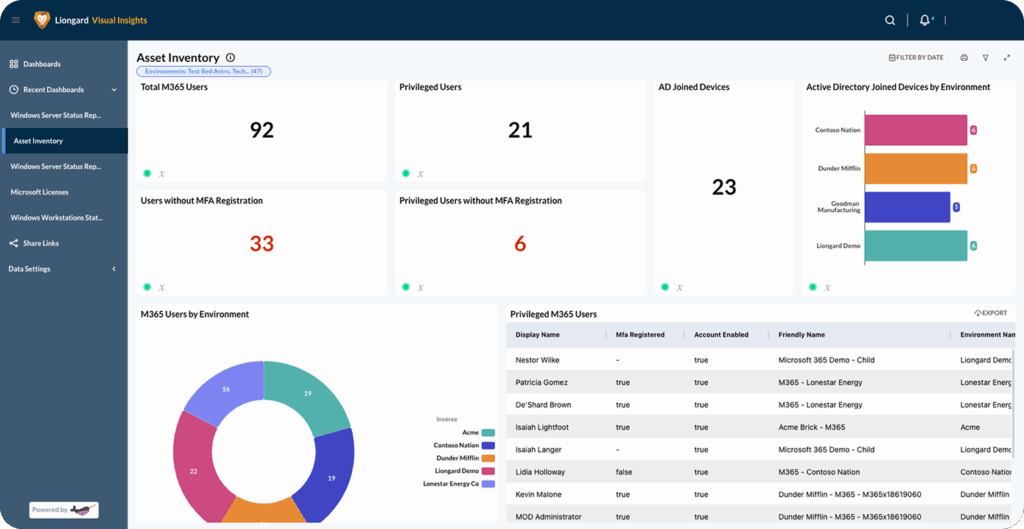
-Asset Inventory Dashboard: Combine data from Microsoft 365 and Active Directory to view devices, users, and inventory at a glance.
All dashboards are live, filterable, customizable and ready to share.
Prep QBRs in Minutes, Not Hours
Not sure where to start? Here’s one real-world use case. Use Liongard Visual Insights to turn raw system data into clear, client-ready dashboards. Whether it’s showing licensing status, system health, or progress on past recommendations, Liongard makes it easy to demonstrate value in every conversation.
Feature Tour: See how Visual Insights simplifies QBR prep and makes client conversations smarter.
-Highlight wins and progress
-Prove risk reduction and action taken
-Spot gaps and recommend next steps
Bring Data to Life
Prove value, drive decisions, and see what’s next.
Liongard Visual Insights: helps you ditch spreadsheets and static exports by replacing them with live, meaningful dashboards that power smarter decisions at every level.
Book a Discovery Call
See firsthand how Liongard's Attack Surface Management platform helps you manage changes and make you more efficient and profitable.
REQUEST A DEMO